In-situ feature extraction of large scale combustion simulations using segmented merge trees
A.G. Landge, V. Pascucci, A. Gyulassy, J.C. Bennett, H. Kolla, J. Chen, P.-T. Bremer.
“In-situ feature extraction of large scale combustion simulations using segmented merge trees,” In Proceedings of the International Conference for High Performance Computing, Networking, Storage and Analysis (SC 2014), New Orleans, Louisana, IEEE Press, Piscataway, NJ, USA pp. 1020--1031. 2014.
ISBN: 978-1-4799-5500-8
DOI: 10.1109/SC.2014.88
ABSTRACT
The ever increasing amount of data generated by scientific simulations coupled with system I/O constraints are fueling a need for in-situ analysis techniques. Of particular interest are approaches that produce reduced data representations while maintaining the ability to redefine, extract, and study features in a post-process to obtain scientific insights.
This paper presents two variants of in-situ feature extraction techniques using segmented merge trees, which encode a wide range of threshold based features. The first approach is a fast, low communication cost technique that generates an exact solution but has limited scalability. The second is a scalable, local approximation that nevertheless is guaranteed to correctly extract all features up to a predefined size. We demonstrate both variants using some of the largest combustion simulations available on leadership class supercomputers. Our approach allows state-of-the-art, feature-based analysis to be performed in-situ at significantly higher frequency than currently possible and with negligible impact on the overall simulation runtime.
Visual Exploration of High-Dimensional Data: Subspace Analysis through Dynamic Projections
Shusen Liu, Bei Wang, J.J. Thiagarajan, P.-T. Bremer, V. Pascucci.
“Visual Exploration of High-Dimensional Data: Subspace Analysis through Dynamic Projections,” SCI Technical Report, No. UUSCI-2014-003, SCI Institute, University of Utah, 2014.
ABSTRACT
Understanding high-dimensional data is rapidly becoming a central challenge in many areas of science and engineering. Most current techniques either rely on manifold learning based techniques which typically create a single embedding of the data or on subspace selection to find subsets of the original attributes that highlight the structure. However, the former creates a single, difficult-to-interpret view and assumes the data to be drawn from a single manifold, while the latter is limited to axis-aligned projections with restrictive viewing angles. Instead, we introduce ideas based on subspace clustering that can faithfully represent more complex data than the axis-aligned projections, yet do not assume the data to lie on a single manifold. In particular, subspace clustering assumes that the data can be represented by a union of low-dimensional subspaces, which can subsequently be used for analysis and visualization. In this paper, we introduce new techniques to reliably estimate both the intrinsic dimension and the linear basis of a mixture of subspaces extracted through subspace clustering. We show that the resulting bases represent the high-dimensional structures more reliably than traditional approaches. Subsequently, we use the bases to define different “viewpoints”, i.e., different projections onto pairs of basis vectors, from which to visualize the data. While more intuitive than non-linear projections, interpreting linear subspaces in terms of the original dimensions can still be challenging. To address this problem, we present new, animated transitions between different views to help the user navigate and explore the high-dimensional space. More specifically, we introduce the view transition graph which contains nodes for each subspace viewpoint and edges for potential transition between views. The transition graph enables users to explore both the structure within a subspace and the relations between different subspaces, for better understanding of the data. Using a number of case studies on well-know reference datasets, we demonstrate that the interactive exploration through such dynamic projections provides additional insights not readily available from existing tools.
Distortion-Guided Structure-Driven Interactive Exploration of High-Dimensional Data
S. Liu, Bei Wang, P.-T. Bremer, V. Pascucci.
“Distortion-Guided Structure-Driven Interactive Exploration of High-Dimensional Data,” In Computer Graphics Forum, Vol. 33, No. 3, Wiley-Blackwell, pp. 101--110. June, 2014.
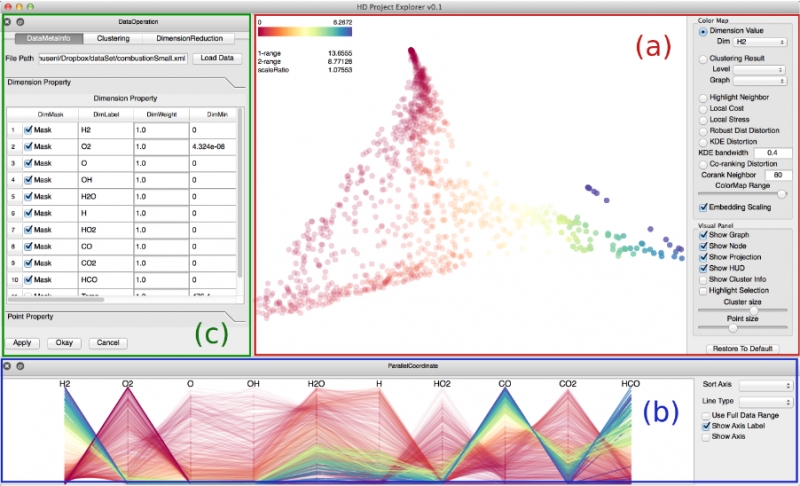
ABSTRACT
Dimension reduction techniques are essential for feature selection and feature extraction of complex high-dimensional data. These techniques, which construct low-dimensional representations of data, are typically geometrically motivated, computationally efficient and approximately preserve certain structural properties of the data. However, they are often used as black box solutions in data exploration and their results can be difficult to interpret. To assess the quality of these results, quality measures, such as co-ranking [ LV09 ], have been proposed to quantify structural distortions that occur between high-dimensional and low-dimensional data representations. Such measures could be evaluated and visualized point-wise to further highlight erroneous regions [ MLGH13 ]. In this work, we provide an interactive visualization framework for exploring high-dimensional data via its two-dimensional embeddings obtained from dimension reduction, using a rich set of user interactions. We ask the following question: what new insights do we obtain regarding the structure of the data, with interactive manipulations of its embeddings in the visual space? We augment the two-dimensional embeddings with structural abstrac- tions obtained from hierarchical clusterings, to help users navigate and manipulate subsets of the data. We use point-wise distortion measures to highlight interesting regions in the domain, and further to guide our selection of the appropriate level of clusterings that are aligned with the regions of interest. Under the static setting, point-wise distortions indicate the level of structural uncertainty within the embeddings. Under the dynamic setting, on-the-fly updates of point-wise distortions due to data movement and data deletion reflect structural relations among different parts of the data, which may lead to new and valuable insights.
Multivariate Volume Visualization through Dynamic Projections
Shusen Liu, Bei Wang, J.J. Thiagarajan, P.-T. Bremer, V. Pascucci.
“Multivariate Volume Visualization through Dynamic Projections,” In Proceedings of the IEEE Symposium on Large Data Analysis and Visualization (LDAV), 2014.
ABSTRACT
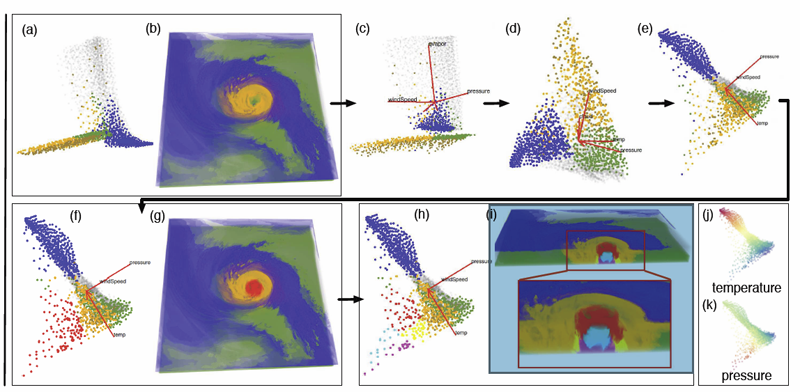
We propose a multivariate volume visualization framework that tightly couples dynamic projections with a high-dimensional transfer function design for interactive volume visualization. We assume that the complex, high-dimensional data in the attribute space can be well-represented through a collection of low-dimensional linear subspaces, and embed the data points in a variety of 2D views created as projections onto these subspaces. Through dynamic projections, we present animated transitions between different views to help the user navigate and explore the attribute space for effective transfer function design. Our framework not only provides a more intuitive understanding of the attribute space but also allows the design of the transfer function under multiple dynamic views, which is more flexible than being restricted to a single static view of the data. For large volumetric datasets, we maintain interactivity during the transfer function design via intelligent sampling and scalable clustering. Using examples in combustion and climate simulations, we demonstrate how our framework can be used to visualize interesting structures in the volumetric space.
Topology-Based Active Learning
D. Maljovec, Bei Wang, J. Moeller, V. Pascucci.
“Topology-Based Active Learning,” SCI Technical Report, No. UUSCI-2014-001, SCI Institute, University of Utah, 2014.
ABSTRACT
A common problem in simulation and experimental research involves obtaining time-consuming, expensive, or potentially hazardous samples from an arbitrary dimension parameter space. For example, many simulations modeled on supercomputers can take days or weeks to complete, so it is imperative to select samples in the most informative and interesting areas of the parameter space. In such environments, maximizing the potential gain of information is achieved through active learning (adaptive sampling). Though the topic of active learning is well-studied, this paper provides a new perspective on the problem. We consider topologybased batch selection strategies for active learning which are ideal for environments where parallel or concurrent experiments are able to be run, yet each has a heavy cost. These strategies utilize concepts derived from computational topology to choose a collection of locally distinct, optimal samples before updating the surrogate model. We demonstrate through experiments using a several different batch sizes that topology-based strategies have comparable and sometimes superior performance, compared to conventional approaches.
Analyzing Simulation-Based {PRA} Data Through Clustering: a {BWR} Station Blackout Case Study
D. Maljovec, S. Liu, Bei Wang, V. Pascucci, P.-T. Bremer, D. Mandelli, C. Smith.
“Analyzing Simulation-Based PRA Data Through Clustering: a BWR Station Blackout Case Study,” In Proceedings of the Probabilistic Safety Assessment & Management conference (PSAM), 2014.
ABSTRACT
Dynamic probabilistic risk assessment (DPRA) methodologies couple system simulator codes (e.g., RELAP, MELCOR) with simulation controller codes (e.g., RAVEN, ADAPT). Whereas system simulator codes accurately model system dynamics deterministically, simulation controller codes introduce both deterministic (e.g., system control logic, operating procedures) and stochastic (e.g., component failures, parameter uncertainties) elements into the simulation. Typically, a DPRA is performed by 1) sampling values of a set of parameters from the uncertainty space of interest (using the simulation controller codes), and 2) simulating the system behavior for that specific set of parameter values (using the system simulator codes). For complex systems, one of the major challenges in using DPRA methodologies is to analyze the large amount of information (i.e., large number of scenarios ) generated, where clustering techniques are typically employed to allow users to better organize and interpret the data. In this paper, we focus on the analysis of a nuclear simulation dataset that is part of the risk-informed safety margin characterization (RISMC) boiling water reactor (BWR) station blackout (SBO) case study. We apply a software tool that provides the domain experts with an interactive analysis and visualization environment for understanding the structures of such high-dimensional nuclear simulation datasets. Our tool encodes traditional and topology-based clustering techniques, where the latter partitions the data points into clusters based on their uniform gradient flow behavior. We demonstrate through our case study that both types of clustering techniques complement each other in bringing enhanced structural understanding of the data.
Overview of New Tools to Perform Safety Analysis: {BWR} Station Black Out Test Case
D. Mandelli, C. Smith, T. Riley, J. Nielsen, J. Schroeder, C. Rabiti, A. Alfonsi, J. Cogliati, R. Kinoshita, V. Pascucci, Bei Wang, D. Maljovec.
“Overview of New Tools to Perform Safety Analysis: BWR Station Black Out Test Case,” In Proceedings of the Probabilistic Safety Assessment & Management conference (PSAM), 2014.
ABSTRACT
The existing fleet of nuclear power plants is in the process of extending its lifetime and increasing the power generated from these plants via power uprates. In order to evaluate the impacts of these two factors on the safety of the plant, the Risk Informed Safety Margin Characterization project aims to provide insights to decision makers through a series of simulations of the plant dynamics for different initial conditions (e.g., probabilistic analysis and uncertainty quantification). This paper focuses on the impacts of power uprate on the safety margin of a boiling water reactor for a station black-out event. Analysis is performed by using a combination of thermal-hydraulic codes and a stochastic analysis tool currently under development at the Idaho National Laboratory, i.e. RAVEN. We employed both classical statistical tools, i.e. Monte-Carlo, and more advanced machine learning based algorithms to perform uncertainty quantification in order to quantify changes in system performance and limitations as a consequence of power uprate. We also employed advanced data analysis and visualization tools that helped us to correlate simulation outcomes such as maximum core temperature with a set of input uncertain parameters. Results obtained give a detailed investigation of the issues associated with a plant power uprate including the effects of station black-out accident scenarios. We were able to quantify how the timing of specific events was impacted by a higher nominal reactor core power. Such safety insights can provide useful information to the decision makers to perform risk-informed margins management.
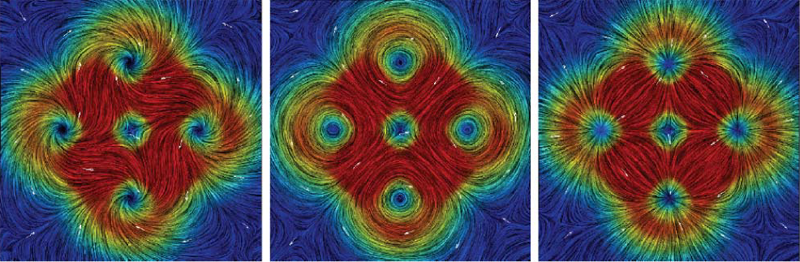
{2D} Vector Field Simplification Based on Robustness
P. Skraba, Bei Wang, G. Chen, P. Rosen.
“2D Vector Field Simplification Based on Robustness,” In Proceedings of the 2014 IEEE Pacific Visualization Symposium, PacificVis, Note: Awarded Best Paper!, 2014.
ABSTRACT
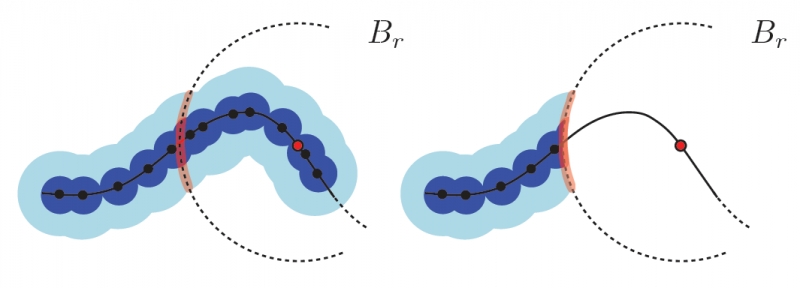
Vector field simplification aims to reduce the complexity of the flow by removing features in order of their relevance and importance, to reveal prominent behavior and obtain a compact representation for interpretation. Most existing simplification techniques based on the topological skeleton successively remove pairs of critical points connected by separatrices, using distance or area-based relevance measures. These methods rely on the stable extraction of the topological skeleton, which can be difficult due to instability in numerical integration, especially when processing highly rotational flows. These geometric metrics do not consider the flow magnitude, an important physical property of the flow. In this paper, we propose a novel simplification scheme derived from the recently introduced topological notion of robustness, which provides a complementary view on flow structure compared to the traditional topological-skeleton-based approaches. Robustness enables the pruning of sets of critical points according to a quantitative measure of their stability, that is, the minimum amount of vector field perturbation required to remove them. This leads to a hierarchical simplification scheme that encodes flow magnitude in its perturbation metric. Our novel simplification algorithm is based on degree theory, has fewer boundary restrictions, and so can handle more general cases. Finally, we provide an implementation under the piecewise-linear setting and apply it to both synthetic and real-world datasets.
P. Skraba, Bei Wang.
“Approximating Local Homology from Samples,” In Proceedings 25th Annual ACM-SIAM Symposium on Discrete Algorithms (SODA), pp. 174-192. 2014.
ABSTRACT
Recently, multi-scale notions of local homology (a variant of persistent homology) have been used to study the local structure of spaces around a given point from a point cloud sample. Current reconstruction guarantees rely on constructing embedded complexes which become diffcult to construct in higher dimensions. We show that the persistence diagrams used for estimating local homology can be approximated using families of Vietoris-Rips complexes, whose simpler construction are robust in any dimension. To the best of our knowledge, our results, for the first time make applications based on local homology, such as stratification learning, feasible in high dimensions.
Towards Paint and Click: Unified Interactions for Image Boundaries
B. Summa, A.A. Gooch, G. Scorzelli, V. Pascucci.
“Towards Paint and Click: Unified Interactions for Image Boundaries,” SCI Technical Report, No. UUSCI-2014-004, SCI Institute, University of Utah, December, 2014.
ABSTRACT
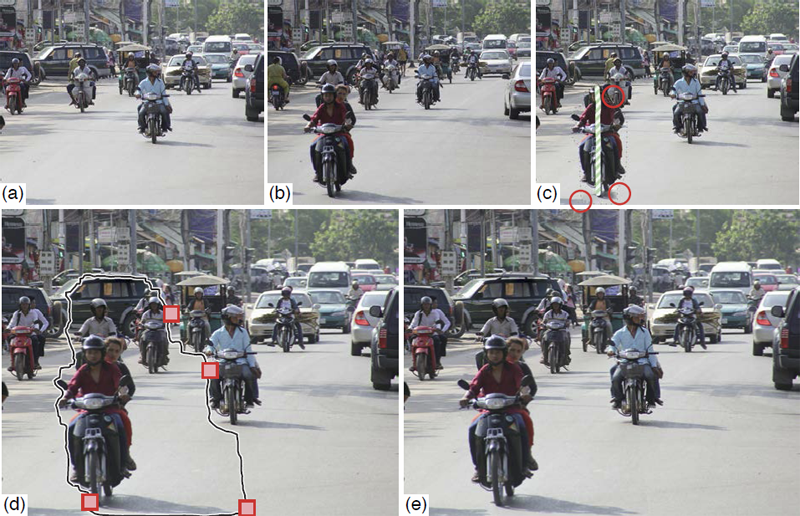
Image boundaries are a fundamental component of many interactive digital photography techniques, enabling applications such as segmentation, panoramas, and seamless image composition. Interactions for image boundaries often rely on two complimentary but separate approaches: editing via painting or clicking constraints. In this work, we provide a novel, unified approach for interactive editing of pairwise image boundaries that combines the ease of painting with the direct control of constraints. Rather than a sequential coupling, this new formulation allows full use of both interactions simultaneously, giving users unprecedented flexibility for fast boundary editing. To enable this new approach, we provide technical advancements. In particular, we detail a reformulation of image boundaries as a problem of finding cycles, expanding and correcting limitations of the previous work. Our new formulation provides boundary solutions for painted regions with performance on par with state-of-the-art specialized, paint-only techniques. In addition, we provide instantaneous exploration of the boundary solution space with user constraints. Furthermore, we show how to increase performance and decrease memory consumption through novel strategies and/or optional approximations. Finally, we provide examples of common graphics applications impacted by our new approach.
Data-Parallel Halo Finding with Variable Linking Lengths
W. Widanagamaachchi, P.-T. Bremer, C. Sewell, L.-T. Lo; J. Ahrens, V. Pascucci.
“Data-Parallel Halo Finding with Variable Linking Lengths,” In Proceedings of the 2014 IEEE 4th Symposium on Large Data Analysis and Visualization (LDAV), pp. 27--34. November, 2014.
ABSTRACT
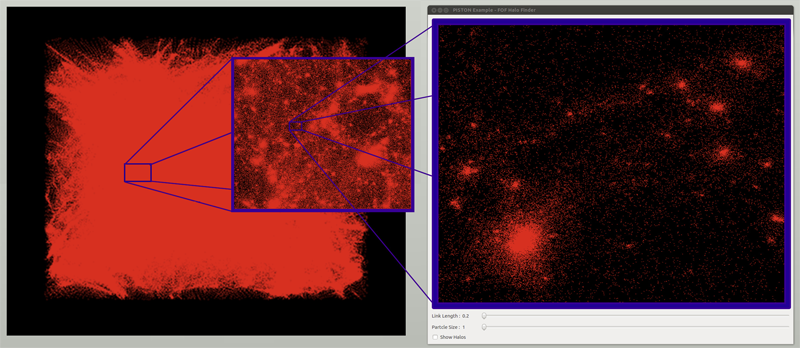
State-of-the-art cosmological simulations regularly contain billions of particles, providing scientists the opportunity to study the evolution of the Universe in great detail. However, the rate at which these simulations generate data severely taxes existing analysis techniques. Therefore, developing new scalable alternatives is essential for continued scientific progress. Here, we present a dataparallel, friends-of-friends halo finding algorithm that provides unprecedented flexibility in the analysis by extracting multiple linking lengths. Even for a single linking length, it is as fast as the existing techniques, and is portable to multi-threaded many-core systems as well as co-processing resources. Our system is implemented using PISTON and is coupled to an interactive analysis environment used to study halos at different linking lengths and track their evolution over time.
2013
The Helmholtz-Hodge Decomposition - A Survey
H. Bhatia, G. Norgard, V. Pascucci, P.-T. Bremer.
“The Helmholtz-Hodge Decomposition - A Survey,” In IEEE Transactions on Visualization and Computer Graphics (TVCG), Vol. 19, No. 8, Note: Selected as Spotlight paper for August 2013 issue, pp. 1386--1404. 2013.
DOI: 10.1109/TVCG.2012.316
ABSTRACT
The Helmholtz-Hodge Decomposition (HHD) describes the decomposition of a flow field into its divergence-free and curl-free components. Many researchers in various communities like weather modeling, oceanology, geophysics, and computer graphics are interested in understanding the properties of flow representing physical phenomena such as incompressibility and vorticity. The HHD has proven to be an important tool in the analysis of fluids, making it one of the fundamental theorems in fluid dynamics. The recent advances in the area of flow analysis have led to the application of the HHD in a number of research communities such as flow visualization, topological analysis, imaging, and robotics. However, because the initial body of work, primarily in the physics communities, research on the topic has become fragmented with different communities working largely in isolation often repeating and sometimes contradicting each others results.
Comments on the “Meshless Helmholtz-Hodge decomposition”
H. Bhatia, G. Norgard, V. Pascucci, P.-T. Bremer.
“Comments on the “Meshless Helmholtz-Hodge decomposition”,” In IEEE Transactions on Visualization and Computer Graphics, Vol. 19, No. 3, pp. 527--528. 2013.
DOI: 10.1109/TVCG.2012.62
ABSTRACT
The Helmholtz-Hodge decomposition (HHD) is one of the fundamental theorems of fluids describing the decomposition of a flow field into its divergence-free, curl-free and harmonic components. Solving for an HDD is intimately connected to the choice of boundary conditions which determine the uniqueness and orthogonality of the decomposition. This article points out that one of the boundary conditions used in a recent paper \"Meshless Helmholtz-Hodge decomposition\" [5] is, in general, invalid and provides an analytical example demonstrating the problem. We hope that this clarification on the theory will foster further research in this area and prevent undue problems in applying and extending the original approach.
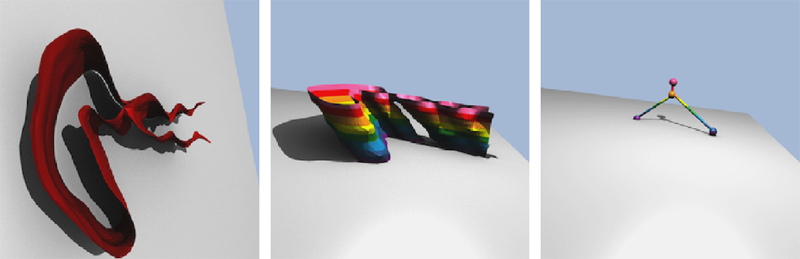
Topology analysis of time-dependent multi-fluid data using the Reeb graph
F. Chen, H. Obermaier, H. Hagen, B. Hamann, J. Tierny, V. Pascucci.
“Topology analysis of time-dependent multi-fluid data using the Reeb graph,” In Computer Aided Geometric Design, Vol. 30, No. 6, pp. 557--566. 2013.
DOI: 10.1016/j.cagd.2012.03.019
ABSTRACT
Liquid–liquid extraction is a typical multi-fluid problem in chemical engineering where two types of immiscible fluids are mixed together. Mixing of two-phase fluids results in a time-varying fluid density distribution, quantitatively indicating the presence of liquid phases. For engineers who design extraction devices, it is crucial to understand the density distribution of each fluid, particularly flow regions that have a high concentration of the dispersed phase. The propagation of regions of high density can be studied by examining the topology of isosurfaces of the density data. We present a topology-based approach to track the splitting and merging events of these regions using the Reeb graphs. Time is used as the third dimension in addition to two-dimensional (2D) point-based simulation data. Due to low time resolution of the input data set, a physics-based interpolation scheme is required in order to improve the accuracy of the proposed topology tracking method. The model used for interpolation produces a smooth time-dependent density field by applying Lagrangian-based advection to the given simulated point cloud data, conforming to the physical laws of flow evolution. Using the Reeb graph, the spatial and temporal locations of bifurcation and merging events can be readily identified supporting in-depth analysis of the extraction process.
Exploring Power Behaviors and Trade-offs of In-situ Data Analytics
M. Gamell, I. Rodero, M. Parashar, J.C. Bennett, H. Kolla, J.H. Chen, P.-T. Bremer, A. Landge, A. Gyulassy, P. McCormick, Scott Pakin, Valerio Pascucci, Scott Klasky.
“Exploring Power Behaviors and Trade-offs of In-situ Data Analytics,” In Proceedings of the International Conference for High Performance Computing, Networking, Storage and Analysis, Association for Computing Machinery, 2013.
ISBN: 978-1-4503-2378-9
DOI: 10.1145/2503210.2503303
ABSTRACT
As scientific applications target exascale, challenges related to data and energy are becoming dominating concerns. For example, coupled simulation workflows are increasingly adopting in-situ data processing and analysis techniques to address costs and overheads due to data movement and I/O. However it is also critical to understand these overheads and associated trade-offs from an energy perspective. The goal of this paper is exploring data-related energy/performance trade-offs for end-to-end simulation workflows running at scale on current high-end computing systems. Specifically, this paper presents: (1) an analysis of the data-related behaviors of a combustion simulation workflow with an in-situ data analytics pipeline, running on the Titan system at ORNL; (2) a power model based on system power and data exchange patterns, which is empirically validated; and (3) the use of the model to characterize the energy behavior of the workflow and to explore energy/performance trade-offs on current as well as emerging systems.
Keywords: SDAV
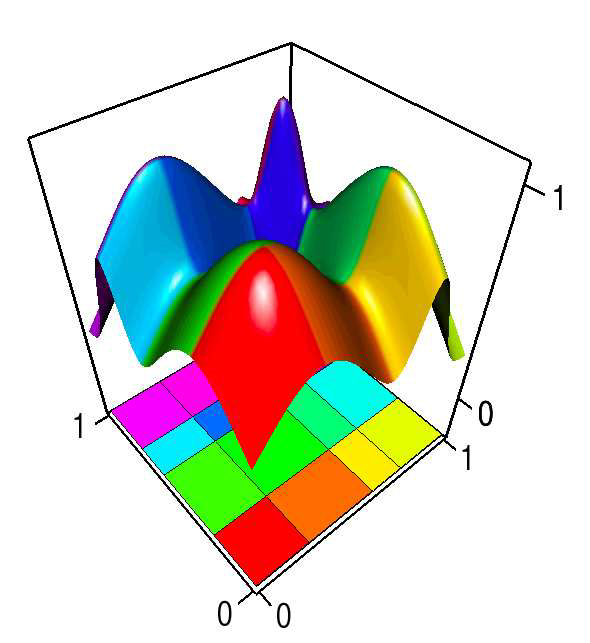
Morse-Smale Regression
S. Gerber, O. Reubel, P.-T. Bremer, V. Pascucci, R.T. Whitaker.
“Morse-Smale Regression,” In Journal of Computational and Graphical Statistics, Vol. 22, No. 1, pp. 193--214. 2013.
DOI: 10.1080/10618600.2012.657132
ABSTRACT
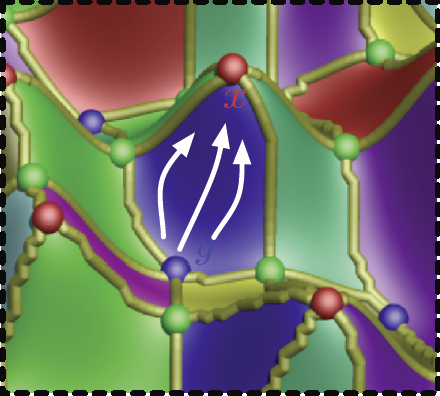
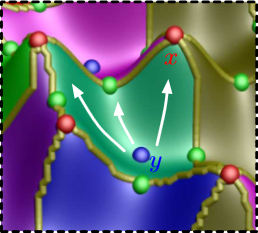
This paper introduces a novel partition-based regression approach that incorporates topological information. Partition-based regression typically introduce a quality-of-fit-driven decomposition of the domain. The emphasis in this work is on a topologically meaningful segmentation. Thus, the proposed regression approach is based on a segmentation induced by a discrete approximation of the Morse-Smale complex. This yields a segmentation with partitions corresponding to regions of the function with a single minimum and maximum that are often well approximated by a linear model. This approach yields regression models that are amenable to interpretation and have good predictive capacity. Typically, regression estimates are quantified by their geometrical accuracy. For the proposed regression, an important aspect is the quality of the segmentation itself. Thus, this paper introduces a new criterion that measures the topological accuracy of the estimate. The topological accuracy provides a complementary measure to the classical geometrical error measures and is very sensitive to over-fitting. The Morse-Smale regression is compared to state-of-the-art approaches in terms of geometry and topology and yields comparable or improved fits in many cases. Finally, a detailed study on climate-simulation data demonstrates the application of the Morse-Smale regression. Supplementary materials are available online and contain an implementation of the proposed approach in the R package msr, an analysis and simulations on the stability of the Morse-Smale complex approximation and additional tables for the climate-simulation study.
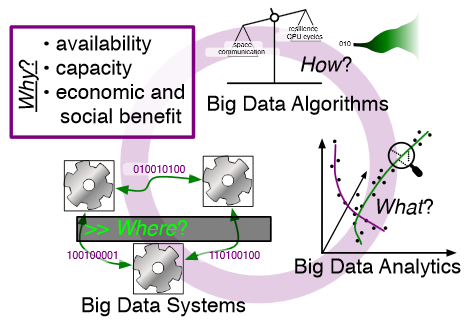
Rethinking Abstractions for Big Data: Why, Where, How, and What
M. Hall, R.M. Kirby, F. Li, M.D. Meyer, V. Pascucci, J.M. Phillips, R. Ricci, J. Van der Merwe, S. Venkatasubramanian.
“Rethinking Abstractions for Big Data: Why, Where, How, and What,” In Cornell University Library, 2013.
ABSTRACT
Big data refers to large and complex data sets that, under existing approaches, exceed the capacity and capability of current compute platforms, systems software, analytical tools and human understanding [7]. Numerous lessons on the scalability of big data can already be found in asymptotic analysis of algorithms and from the high-performance computing (HPC) and applications communities. However, scale is only one aspect of current big data trends; fundamentally, current and emerging problems in big data are a result of unprecedented complexity |in the structure of the data and how to analyze it, in dealing with unreliability and redundancy, in addressing the human factors of comprehending complex data sets, in formulating meaningful analyses, and in managing the dense, power-hungry data centers that house big data.
The computer science solution to complexity is finding the right abstractions, those that hide as much triviality as possible while revealing the essence of the problem that is being addressed. The "big data challenge" has disrupted computer science by stressing to the very limits the familiar abstractions which define the relevant subfields in data analysis, data management and the underlying parallel systems. Efficient processing of big data has shifted systems towards increasingly heterogeneous and specialized units, with resilience and energy becoming important considerations. The design and analysis of algorithms must now incorporate emerging costs in communicating data driven by IO costs, distributed data, and the growing energy cost of these operations. Data analysis representations as structural patterns and visualizations surpass human visual bandwidth, structures studied at small scale are rare at large scale, and large-scale high-dimensional phenomena cannot be reproduced at small scale.
As a result, not enough of these challenges are revealed by isolating abstractions in a traditional soft-ware stack or standard algorithmic and analytical techniques, and attempts to address complexity either oversimplify or require low-level management of details. The authors believe that the abstractions for big data need to be rethought, and this reorganization needs to evolve and be sustained through continued cross-disciplinary collaboration.
In what follows, we first consider the question of why big data and why now. We then describe the where (big data systems), the how (big data algorithms), and the what (big data analytics) challenges that we believe are central and must be addressed as the research community develops these new abstractions. We equate the biggest challenges that span these areas of big data with big mythological creatures, namely cyclops, that should be conquered.
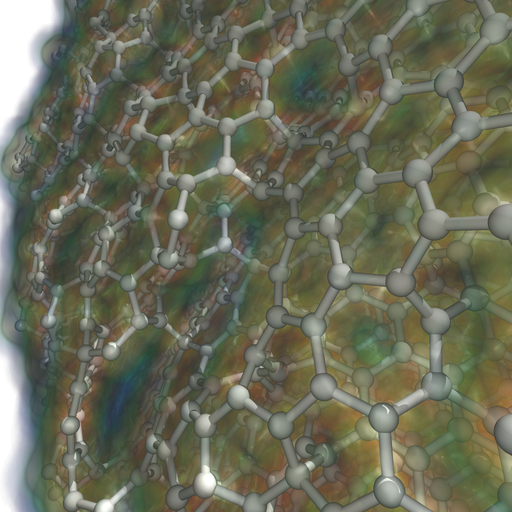
Ray Tracing and Volume Rendering Large Molecular Data on Multi-core and Many-core Architectures.
A. Knoll, I. Wald, P. Navratil, M. E Papka,, K. P Gaither.
“Ray Tracing and Volume Rendering Large Molecular Data on Multi-core and Many-core Architectures.,” In Proc. 8th International Workshop on Ultrascale Visualization at SC13 (Ultravis), 2013, 2013.
ABSTRACT
Visualizing large molecular data requires efficient means of rendering millions of data elements that combine glyphs, geometry and volumetric techniques. The geometric and volumetric loads challenge traditional rasterization-based vis methods. Ray casting presents a scalable and memory- efficient alternative, but modern techniques typically rely on GPU-based acceleration to achieve interactive rendering rates. In this paper, we present bnsView, a molecular visualization ray tracing framework that delivers fast volume rendering and ball-and-stick ray casting on both multi-core CPUs andmany-core Intel ® Xeon PhiTM co-processors, implemented in a SPMD language that generates efficient SIMD vector code for multiple platforms without source modification. We show that our approach running on co- processors is competitive with similar techniques running on GPU accelerators, and we demonstrate large-scale parallel remote visualization from TACC's Stampede supercomputer to large-format display walls using this system.
Characterization and modeling of {PIDX} parallel {I/O} for performance optimization
S. Kumar, A. Saha, V. Vishwanath, P. Carns, J.A. Schmidt, G. Scorzelli, H. Kolla, R. Grout, R. Latham, R. Ross, M.E. Papka, J. Chen, V. Pascucci.
“Characterization and modeling of PIDX parallel I/O for performance optimization,” In Proceedings of SC13: International Conference for High Performance Computing, Networking, Storage and Analysis, pp. 67. 2013.
ABSTRACT
Parallel I/O library performance can vary greatly in response to user-tunable parameter values such as aggregator count, file count, and aggregation strategy. Unfortunately, manual selection of these values is time consuming and dependent on characteristics of the target machine, the underlying file system, and the dataset itself. Some characteristics, such as the amount of memory per core, can also impose hard constraints on the range of viable parameter values. In this work we address these problems by using machine learning techniques to model the performance of the PIDX parallel I/O library and select appropriate tunable parameter values. We characterize both the network and I/O phases of PIDX on a Cray XE6 as well as an IBM Blue Gene/P system. We use the results of this study to develop a machine learning model for parameter space exploration and performance prediction.
Exploration of High-Dimensional Scalar Function for Nuclear Reactor Safety Analysis and Visualization
D. Maljovec, Bei Wang, V. Pascucci, P.-T. Bremer, M.Pernice, D. Mandelli, R. Nourgaliev.
“Exploration of High-Dimensional Scalar Function for Nuclear Reactor Safety Analysis and Visualization,” In Proceedings of the 2013 International Conference on Mathematics and Computational Methods Applied to Nuclear Science & Engineering (M&C), pp. 712-723. 2013.
ABSTRACT
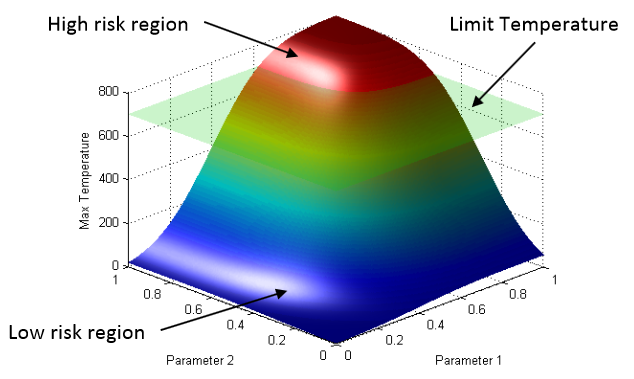
The next generation of methodologies for nuclear reactor Probabilistic Risk Assessment (PRA) explicitly accounts for the time element in modeling the probabilistic system evolution and uses numerical simulation tools to account for possible dependencies between failure events. The Monte-Carlo (MC) and the Dynamic Event Tree (DET) approaches belong to this new class of dynamic PRA methodologies. A challenge of dynamic PRA algorithms is the large amount of data they produce which may be difficult to visualize and analyze in order to extract useful information. We present a software tool that is designed to address these goals. We model a large-scale nuclear simulation dataset as a high-dimensional scalar function defined over a discrete sample of the domain. First, we provide structural analysis of such a function at multiple scales and provide insight into the relationship between the input parameters and the output. Second, we enable exploratory analysis for users, where we help the users to differentiate features from noise through multi-scale analysis on an interactive platform, based on domain knowledge and data characterization. Our analysis is performed by exploiting the topological and geometric properties of the domain, building statistical models based on its topological segmentations and providing interactive visual interfaces to facilitate such explorations. We provide a user's guide to our software tool by highlighting its analysis and visualization capabilities, along with a use case involving data from a nuclear reactor safety simulation.